UM:Overlay Histogram
Hot key : F11
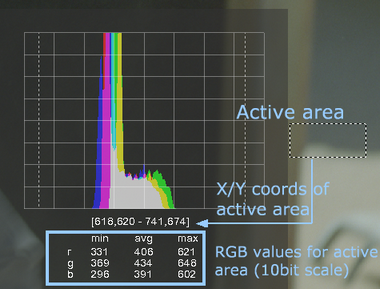
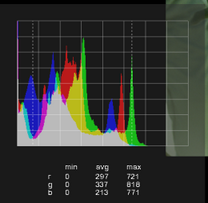
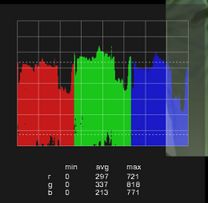
The histogram tool displays a graph of RGB colour information :
| • | For the entire image or |
| • | A selected area of the image |
This can be useful in helping identify how much colour correction is needed.
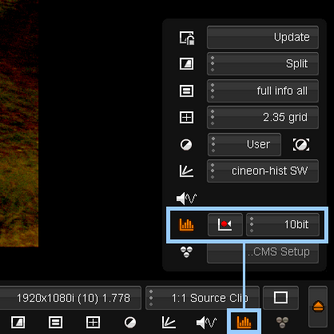
The button on the left activates the histogram, which will be displayed in the manner and location defined by the current graphs setting.
Options
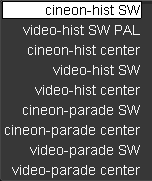
The available graph positions and types are as per the graphs.
Unlike the Graphs settings, the Histogram settings can be set in a histogram mode (RGB values overlaid) or a parade mode (RGB values separated in columns). |
Setup
Graph Setup |
|
Toggle display of graph. |
|
Reset graph active area to default (whole image) |
|
Set the scale to use for the reported graph values. Values : 8,10,16 bit or 0-1. Default : 10bit |
|
Area Selection
By default, the histogram will display RGB values related to the entire image.
You can select a region of interest with the mouse interactively.
You can also click anywhere on the image to display information about a single pixel.
Display Modes
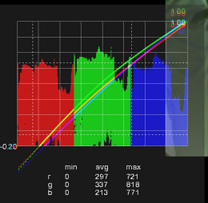
Note that you can display graphs (colour curves) and histograms (or parades) simultaneously.
