UM:Overlay Graphs
From DigitalVision
Graphs
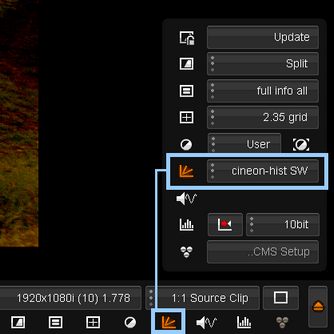
Hot key : F10
The graph tool serves three purposes :
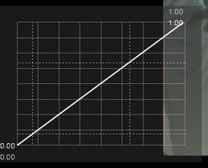
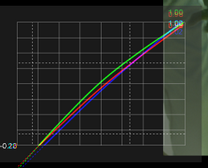
| • | It shows the RGB response curves of your shots |
| • | It shows the value ranges using dotted lines on the graph (including important value levels) |
| • | It defines how and where the histogram graph will be displayed when enabled |
Options
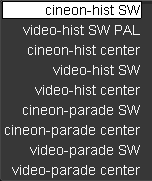
This drop-down list defines available graphs and histograms.
Note that graphs ignore the "hist" and "parade" settings, using only the location (e.g. center), size (e.g. PAL) and scaling information (e.g. cineon). |
These options are configured via plain text files (*.graphs) located inside the folder specified inside the general.prefs file (variable monitorGraphDir).
Named sections inside these files specify the listed options above.
Example graph locations are :
| • | SW - south-west in image |
| • | Center - center of image |
Scaling refers to the dotted-lines overlaid on the graph to indicate important graph data points i.e.
| • | Cineon - dotted lines at default cineon black and white points (95/685) |
| • | Video - dotted lines at YCrCb SMPTE levels (64/940) |
Graph Specifications
For the Graph format and specification, see Appendix Graphs Specification.


